Bar and Restaurant Management Made Simple
Food and beverage management software for inventory, ordering, invoicing and access to your establishment’s critical sales data. So you can grow your business faster—from anywhere.
Start Free Today! or schedule time with a product specialist
Integrations See all integrations 


Why you’ll love BevSpot
70% reduction
in time spent on inventory on average
50% less
sitting inventory reported on average
1 place
to manage multiple locations
What you can do with BevSpot See how it works 
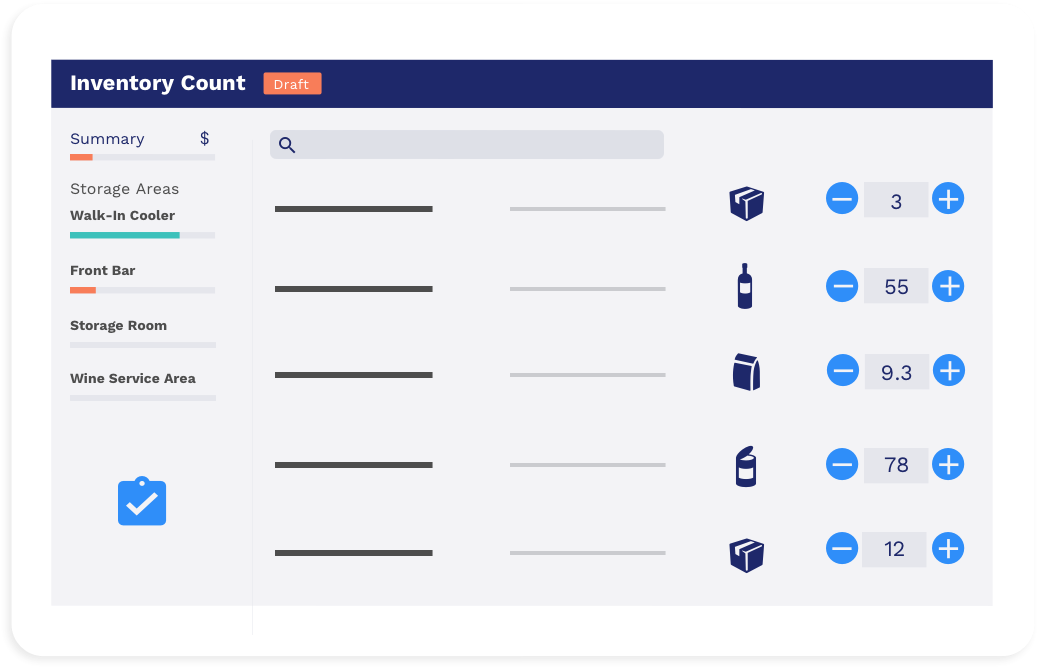
Take inventory any time, any where.
Take inventory faster than ever with shelf to sheet sorting, custom storage areas, offline mode and more.
Learn more about inventory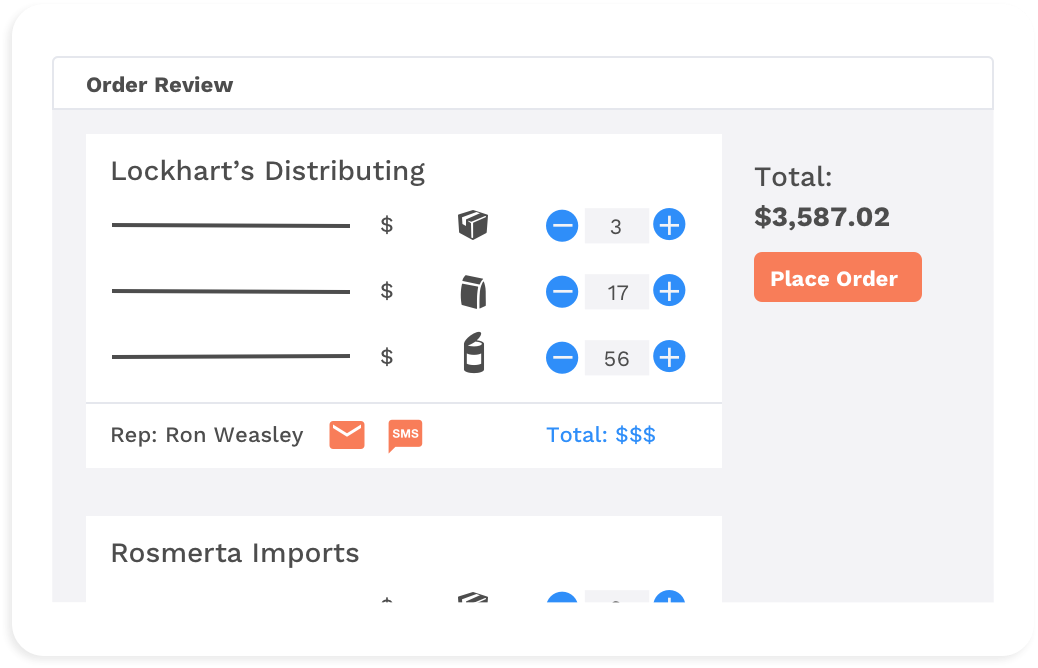
Order confidently in just one click, no matter where you are.
Order from your vendors right in BevSpot, and use features like Smart Cart and Expected Inventory to fill your cart based on weekly usage or pars.
Learn more about ordering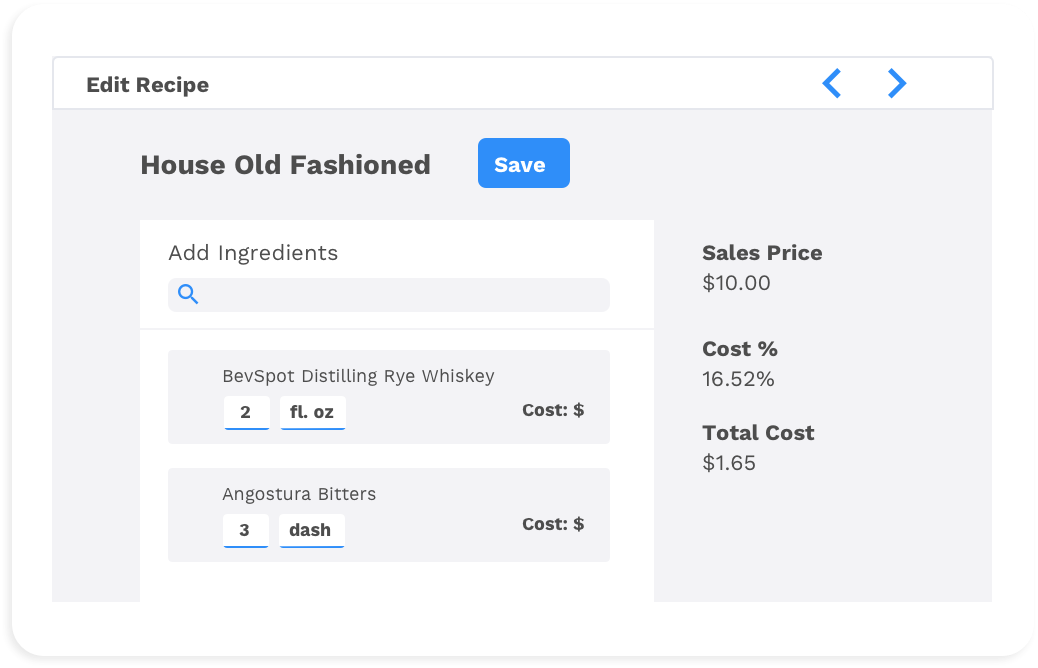
Master your cost percentage with recipes and menu items.
Easily create and manage recipes, track cost percentage and ingredient price changes, then swap ingredients in and out of recipes to create the tastiest and most profitable menu for your business.
Learn more about recipe costing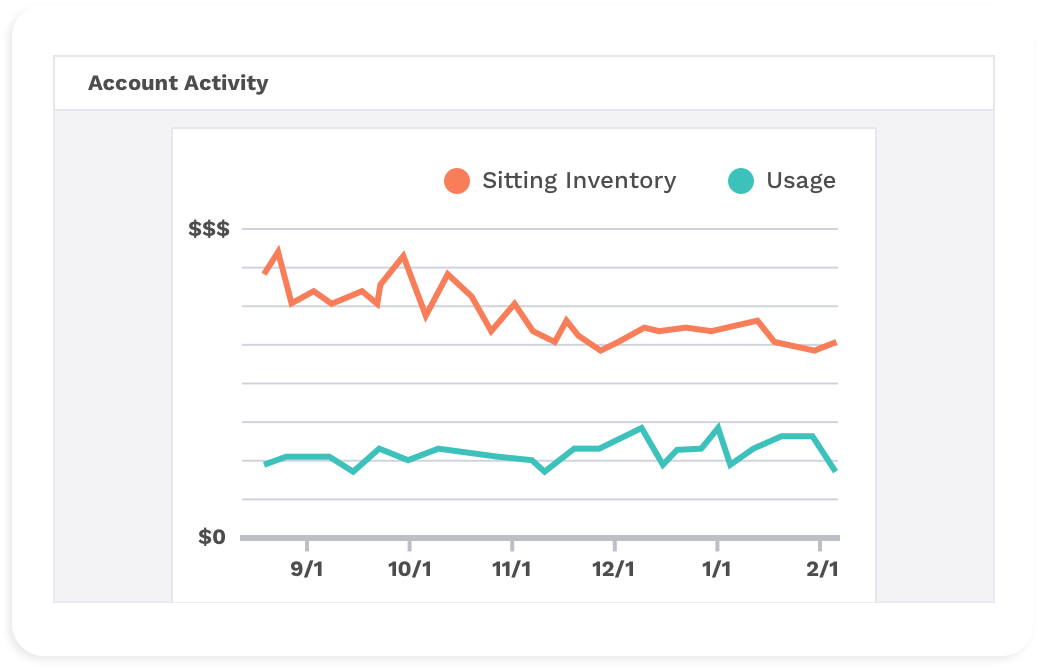
Get fast and insightful analytics to help you manage your business.
Our reports include helpful charts and graphs making it easy to track and compare sitting inventory and COGS. Our price tracker shows price fluctuations overtime and helps you to identify opportunities to save.
Learn more about reporting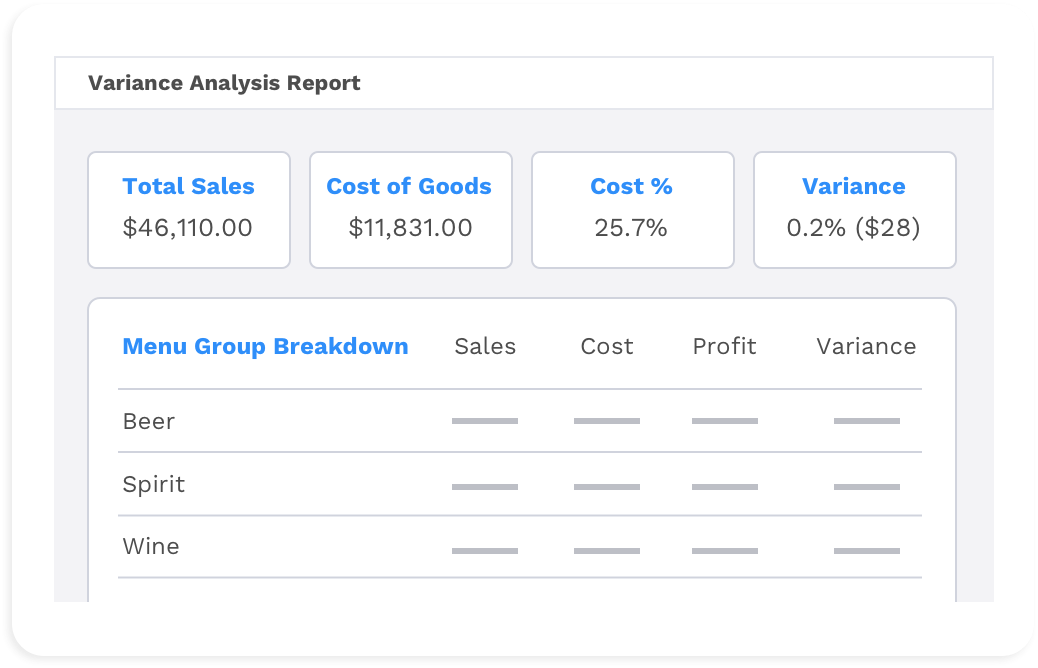
Monitor item-level variance and menu profitability.
BevSpot connects sales and inventory to your POS system for a complete picture of what you’re selling.
Learn more about sales
This system is so insanely easy. I’ve worked with a bunch of other systems and nothing has been this easy before.

- John Galeno, GM
Tonno - Wakefield Resurrection
It was really easy to contact the onboarding team whenever we needed to. The training calls really helped to get us up to speed.
- Ryan Vermillion, Asst. Food & Beverage Manager
Marriott at West Des Moines
It’s easy to use. Inventory is a breeze. Ordering is super easy. I love it!
- Frank Kraemer
Hilton Garden Inn
Very user friendly with a lot of options to help, along with the BevSpot team! BevSpot has been huge for myself during our opening!